Statistical Analysis of Rally Barbados 2014 Stage Times – Day 1
With the dust settled on Sol Rally Barbados 2014 it is quite interesting to analyse the stage times for each driver to look for consistency, speed and how the times change at night.
Who was the most consistent driver on Day 1?
Who was the fastest driver at night?
For this, we analysed the daylight stage times and compared each run (on the same stage) to the previous run. From this, we can work out the time difference (improvement) on each run to find out who was the fastest out of the blocks and who took the longest to get up to speed.
The Top 10 Most Consistent Drivers
These are the drivers whose times changed the least run-to-run, ie. they got the closest to their fastest run quickly and either didn’t improve or slow down from this time - the fastest out of the blocks (for their own time).
Pos. | Average (mean) difference | Driver Name |
1 | 00:01.41 | Jeremy Sisnett |
2 | 00:01.83 | |
3 | 00:02.04 | |
4 | 00:02.53 | |
5 | 00:02.61 | Paul Horton |
6 | 00:02.93 | Paul Inniss |
7 | 00:02.96 | |
8 | 00:03.05 | |
9 | 00:03.31 | |
10 | 00:03.40 |
Well done Jeremy Sisnett and also Paul Bird - given his incredible pace early on to keep such consistency shows why his initial lead was so large.
If only Mark Thompson could have kept the consistency all rally long...
The top 10 Least Consistent Drivers
ie. this is the drivers whose times varied the most stage-to-stage. This could be due to getting used to a new car/conditions/setup, taking time to settle, making mistakes, clowning around or just pussy-footing about not getting down to business.
Pos. | Average (mean) difference | Driver Name |
1 | 07:14.13 | Brian Watson |
2 | 06:30.58 | Eric Allamby |
3 | 05:05.50 | Fabien Clarke |
4 | 04:58.13 | Ding Boston |
5 | 04:46.93 | Dick Mauger |
6 | 04:37.19 | Cheryl Spencer (F) |
7 | 00:56.75 | |
8 | 00:41.83 | Winston Thompson |
9 | 00:31.41 | David Brewster |
10 | 00:28.97 |
slow starts, off-the-road incidents, learning new cars and a general lack of right foot confidence?
The Top 10 Fastest Night Drivers
To calculate this, we compared the time posted of the night run of the stage to the drivers’ fastest daytime run on that stage. This is then the (mean) average of all the night run differences to fastest daylight run.
Pos. | Average (mean) difference | Driver Name |
1 | 00:03.54 | Paul Horton |
2 | 00:04.60 | Rupert Lomax |
3 | 00:05.02 | |
4 | 00:05.27 | |
5 | 00:05.37 | |
6 | 00:05.65 | |
7 | 00:06.11 | |
8 | 00:06.25 | |
9 | 00:06.30 | |
10 | 00:06.39 |
It is interesting to note that 3 of the top 5 (in fact the top two) are overseas drivers...
There were also some notable absences on this table due to accidents/retirements – most notably Paul Bird and Martin Atwell – both known to be exceptionally quick at night.
The Top 10 Slowest Night Drivers
Pos. | Average (mean) difference | Driver Name |
1 | 01:45.13 | |
2 | 01:37.45 | Cheryl Spencer (F) |
3 | 00:41.83 | |
4 | 00:33.23 | |
5 | 00:29.84 | |
6 | 00:29.51 | Ding Boston |
7 | 00:28.31 | Chris Shooter |
8 | 00:28.21 | Stuart Deeley |
9 | 00:27.61 | Dick Mauger |
10 | 00:27.14 |
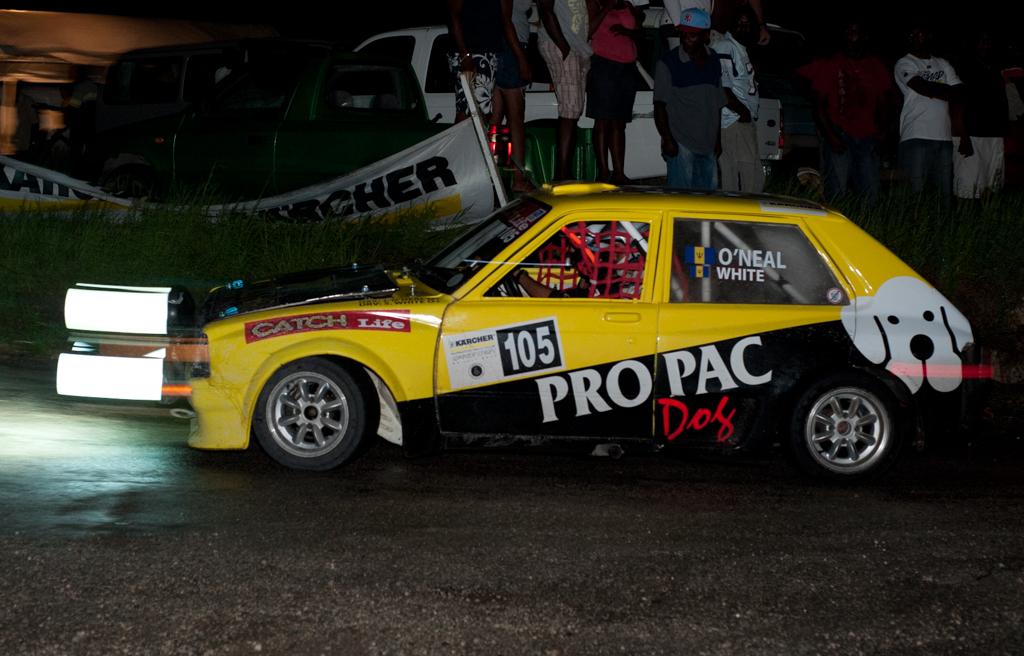
Time to invest in better lights?
Overall Notes:
Accidents and OTLs are included, so these may skew some of the times for the slowest/most inconsistent performances.


Comments